The widest gap in programmatic buying today has nothing to do with the media rate. In the first quarter of 2026, the strongest cohort of advertisers in the ANA Programmatic Transparency Benchmark turned 54 percent of their programmatic spend into impressions that were fraud-free, measurable, viewable, and clear of made-for-advertising inventory. The weakest cohort managed 32.1 percent of the same kind of budget. ANA recorded that 21.9-point spread as the largest in the history of the benchmark and tied it to supply curation and measurement quality rather than price negotiation.
An agency earns its fee on the right side of that spread. Access to a bidder is the quick part and takes days. The slow part is the operating discipline that decides how much of a budget reaches a person watching something they chose to watch. What follows sets out what display, video and connected TV each buy at a working level, and what to hold a partner to in writing.
Category shapes the answer before any of this applies. A Retail & eCommerce advertiser buys against purchase signals, while a Healthcare & Pharma advertiser buys against clearance rules first and audience second. Sector-specific notes sit on the Technology, Gambling & iGaming, Tourism & Travel, Finances, Hospitality, and B2B pages.
What You Are Buying in Each Channel
Media kits describe inventory. Buyers need the trade-off underneath it, so the rows below strip each channel down to the thing being purchased and the way that purchase goes wrong.
Channel | What the money buys | Where it wins | How it fails | The metric that tells the truth |
|---|---|---|---|---|
Repeatable reach and retargeting across the open web | Always-on presence, remarketing, cheap frequency against a known audience | Unmanaged supply, clickbait domains, impressions no eye reached | Viewable and measurable impressions per unique user reached | |
Attention inside content the viewer selected | Mid-funnel persuasion and audience qualification | Outstream units that log a view nobody watched | Completion rate at full length, paired with audibility | |
Household television reach without a broadcast schedule | Incremental reach against light linear viewers in brand-safe content | Frequency blowouts across apps and gaps in delivery measurement | Unduplicated household reach and frequency distribution | |
Attention with no competing screen, or physical proximity | Sequencing and reinforcement between the larger channels | Treated as a leftover line item with recycled creative | Assisted conversion lift against a matched hold-out |
Display: The Channel That Punishes Neglect
Display carries the worst reputation in programmatic and holds the most recoverable waste. The ANA's 2023 supply chain study found the average campaign running across 44,000 websites when a few hundred would have covered most of the intended audience. Two years of pruning followed. By the second quarter of 2025 the median advertiser touched 28,958 active domains, down from 53,799, and median spend on made-for-advertising domains had fallen to 0.8 percent. It dropped again to 0.4 percent by the third quarter.
Curation produced that gain, not creative. The channel itself holds 11.2 percent of US ad spend in the IAB 2026 forecast, marginally ahead of linear television at 11.1 percent, which points to a format that is consolidating rather than disappearing.
Format choice does most of the remaining work. Standard banners suit retargeting and low-cost frequency. Native placements sit inside editorial and earn longer dwell time, in-app inventory delivers full-screen impact with stronger viewability, and conversational units turn an impression into a two-way exchange that qualifies a lead before the click. Our Programmatic Display Agency Guide for Global Brands breaks down how those choices shift by market.
One request settles most agency conversations about display. Ask for the domain count from last month alongside the inclusion list, then ask what was removed and why. A partner running a governed supply chain answers with numbers in minutes. If the answer arrives as reassurance about brand safety tooling, run the underperformance audit instead.
Video: The Format Decides the Outcome
Video splits into environments that behave nothing alike. IAB projects US online video at $20.7 billion this year on 10 percent growth, with social video at $31.9 billion on 13 percent growth, drawn from a survey of 360 media executives run by Advertiser Perceptions in February and March 2026 alongside Guideline data. Those two lines compete for the same brief and reward opposite creative instincts.
In-stream inventory places an ad inside content the viewer chose. Skippable pre-roll on YouTube charges only for engaged views, which turns the first five seconds into the entire media decision. Outstream sits between paragraphs and autoplays into a scroll, which produces volume at low cost and a completion rate worth checking twice. Our best practices for video advertising in DV360 covers the bid and frequency settings that separate the two.
Creative length is a media variable rather than a production preference. Six-second bumpers hold frequency without fatigue. Fifteen-second cuts carry a single proposition. Anything past 30 seconds needs a reason that survives a skip button. Sequencing across programmatic audio reinforces the same message where no screen competes for attention, and our Spotify buying guide sets out how that works through DV360 and Adform.
Finished assets get tested before flight rather than after it. The Creative Showroom exists for that reason.
CTV: Premium Reach With a Measurement Tax
Two credible numbers describe the same market, and the difference between them is definitional rather than factual. eMarketer forecasts US connected TV ad spend near $37.95 billion for 2026. IAB, working from a narrower definition, puts the channel at $29.3 billion growing 11 percent. Either figure sits against the same structural milestone: eMarketer has 2026 CTV upfront commitments at $17.73 billion versus $16.98 billion for primetime linear, the first time streaming has taken the most-watched daypart.
Programmatic followed that audience. Connected TV represented roughly 40 percent of total programmatic spend in the ANA benchmark for the fourth quarter of 2025, and every CTV transaction in that dataset ran through a private marketplace. Curation is no longer a preference in this channel. It is the default transaction type.
The tax arrives in measurement. Server-side ad insertion and thin signal availability push a share of CTV impressions into non-viewable classification even where fraud stays minimal, which means a buyer accepts some blindness in exchange for premium content. Media executives surveyed by IAB rated fraud in open programmatic CTV exchanges their leading worry at 56 percent, followed by unverified publishers or content sources at 48 percent. Cost and audience delivery both registered at 47 percent, up from 41 percent a year earlier.
Targeting has moved well past the age-and-gender bracket that linear offered. Household-level geofencing narrows delivery to postcodes around a store or dealership, a technique our CTV geofencing piece documents in detail. Streaming environments such as Netflix opened ad tiers that behave like premium video inventory with television-scale co-viewing. For a fuller walkthrough of how agencies structure this work, the Connected TV Advertising Agency Guide covers the operating model, while the World Cup 2026 CTV playbook shows what event-driven planning looks like against a fixed calendar.
The Platform Layer, Chosen by Signal
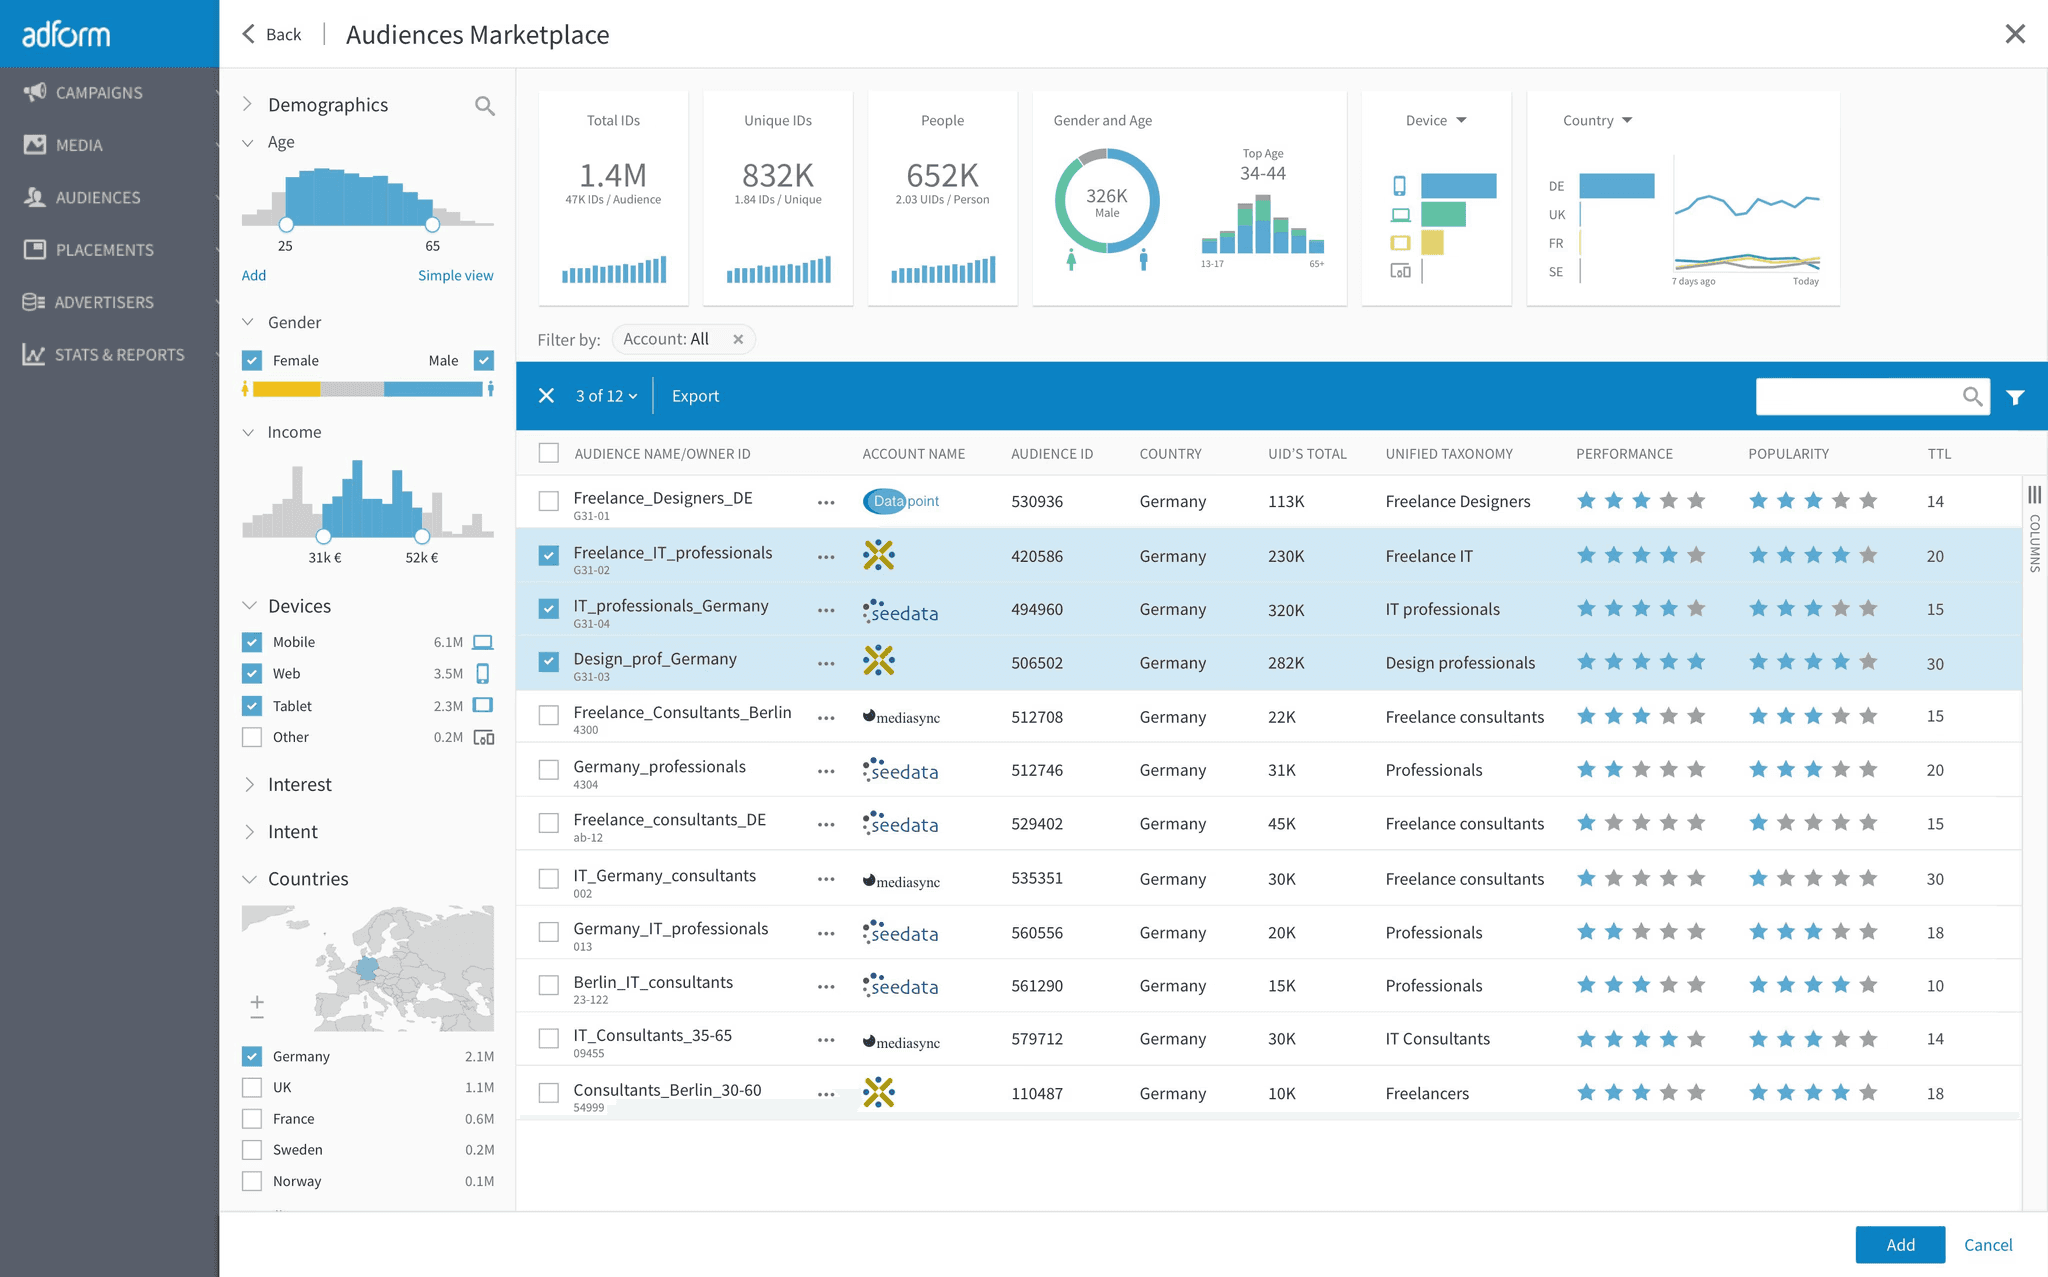
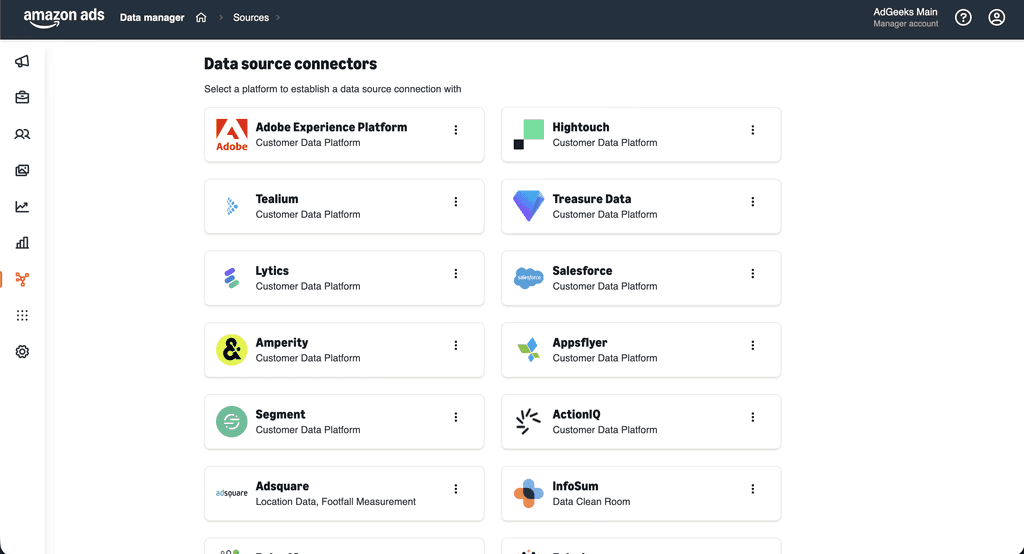
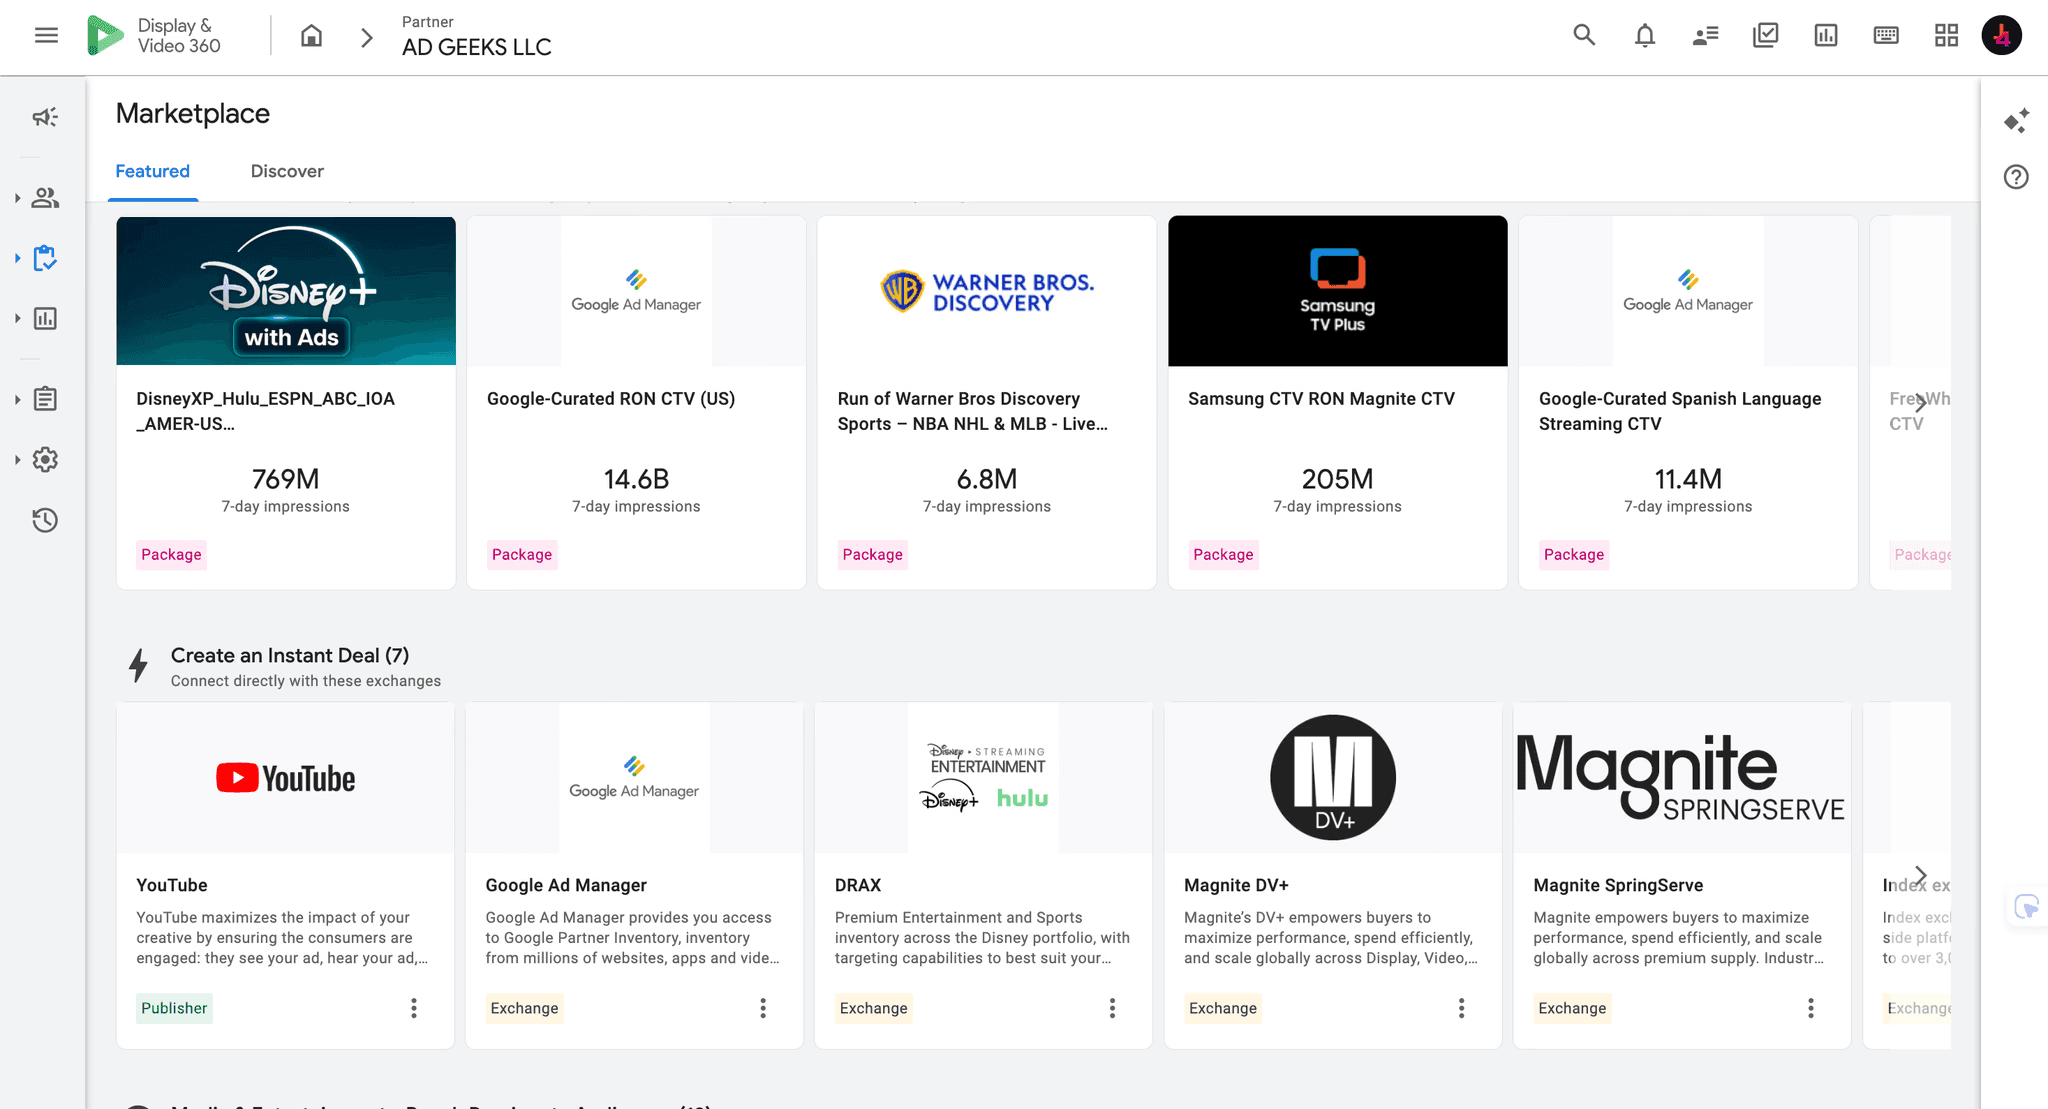
Platform selection follows the audience signal rather than the sales pitch. Display & Video 360 buys the widest open web and YouTube supply and suits campaigns where reach and video sit together. Amazon DSP earns its place where genuine purchase behavior drives the targeting, on and off Amazon properties. Adform answers privacy-first European buying and cookieless preparation. Where a brand runs more than one, duplicated frequency becomes the problem to solve, which is the subject of our multi-DSP matrix.
Enterprise minimums remain the barrier that pushes brands toward managed access. Direct contracts at this tier have historically demanded monthly spend that most independent advertisers never reach, a gate our analysis of the $50,000 threshold addresses directly. Two further pieces cover the mechanics: how to get DV360 access and how DV360 differs from Google Ads.
Two Briefs, Two Builds
A consumer brand entering a new market
Nothing here starts with television. Purchase signal comes first through Amazon DSP, where in-market and new-to-brand audiences carry enough intent to prove a conversion path within weeks. Display retargeting picks up the non-converters at low cost. Connected TV enters once the funnel below it produces reliable data, at which point the upper-funnel budget has something to feed. The Footmender full-funnel market launch and the BANZ USA new-to-brand acquisition campaign both follow that shape.
A B2B vendor with a long sales cycle
Account-based targeting replaces broad reach. Company-level lists narrow delivery to buying committees inside named organizations, with premium business and technology publications supplying the environment. Video does the education work that a banner never will. The Dell campaign across European computer buyers and the J.P. Morgan programmatic ABM build show the structure, while Qodo AI reaching developers demonstrates the narrower version aimed at a technical audience. Background reading sits in our B2B programmatic partner explainer.
Further examples across sectors, including the BP Pulse geo-targeted EV campaign and the Gulf QR payment adoption launch, sit in the full case studies library.
Five Questions That Separate Agencies
Credentials pages look identical across the category. Answers to operational questions do not, and the difference shows up inside a single meeting.
The question | A weak answer | A strong answer |
|---|---|---|
How many domains did my campaign run on last month? | A statement that brand safety tooling is in place | The exact count, the inclusion list, and what was pruned since the previous month |
What share of my CTV budget transacted through private marketplaces? | Most of it | A percentage with deal IDs, plus the reason any open marketplace tail exists |
What sits between my budget and the publisher? | An all-in rate with no breakdown | Itemized platform fee, data costs, and agency margin, with a working media percentage |
Show me frequency distribution rather than average frequency | An average of 3.2 impressions per user | A decile view showing the heavy tail, with the capping logic that manages it |
Which creative variants drove completions last week? | A blended performance summary | Variant-level completion and conversion data, with the next test already defined |
Two further resources help at this stage. Our enterprise agency shortlist sets out selection criteria for larger accounts, and the guide to switching programmatic agencies covers the handover mechanics that protect a live campaign. Buyers comparing managed service models will find the detail in comparing DV360 campaign management services.
The First 30 Days of a New Engagement
A launch sequence tells you as much about a partner as a case study does. The order below reflects how a governed account gets built.
Days 1 to 5. Access and measurement plumbing. Seats issued, conversion tracking verified end to end, and a baseline agreed for every metric that will later be claimed as improvement. Our DV360 setup mistakes piece lists what breaks at this stage.
Days 5 to 10. Supply governance. Inclusion lists built before the first impression serves, private marketplace deals negotiated, and a documented position on open marketplace exposure.
Days 10 to 15. Channel roles and budget split, with a hold-out group reserved for incrementality reading. Audience architecture gets defined here, a subject covered in audience segmentation for higher ROI.
Days 15 to 22. Creative matrix mapped to funnel stage and format, sized for every placement the plan touches rather than resized in a rush after launch.
Days 22 to 30. Reporting cadence fixed, with one primary metric per channel agreed in writing. The framework sits in DV360 reporting metrics that matter, and delivery troubleshooting in our campaign delivery fixes.
Four Assumptions Worth Retiring
Each of the following survives in briefs long after the data stopped supporting it.
The open marketplace is the cheaper option
Private marketplace CPMs averaged $7.15 against $4.41 in the open marketplace in the ANA reading for the second quarter of 2025, so the sticker price is higher. Open marketplace buys ran up to seven times more carbon-intensive in the same dataset and carried the quality drag behind the waste figure. Price per impression is not price per outcome.
CTV works for awareness only
Household geofencing, retargeting from a CTV exposure into display, and postcode-level delivery all attach the channel to measurable outcomes. The US tipping point analysis and the UK growth data both document performance use cases.
Display has run out of road
An 11.2 percent share of US ad spend in the IAB forecast sits ahead of linear television. The format lost its reputation to bad supply chains rather than to weak demand.
More domains means more reach
The 44,000-site average from the ANA study delivered no reach advantage over a few hundred well-chosen properties. Breadth of supply is a cost, not an asset.
A Ten-Line Self-Audit
Run this against a current programmatic account before the next quarterly review. Any line without a confident answer is a line where budget leaks.
The working media percentage of last quarter is a number you have seen, not an estimate
Domain counts have fallen or held steady over the past two quarters
Made-for-advertising exposure is measured monthly against a stated tolerance
Frequency is reported as a distribution with a documented cap per channel
Connected TV delivery is reconciled against a household reach figure rather than impressions alone
Creative variants carry performance data at variant level, with a live testing schedule
A matched hold-out exists for at least one channel
Platform fees, data fees, and agency margin appear as separate lines on an invoice
Someone on the account team names the top five publishers by spend without checking
Cross-channel frequency is managed where more than one platform runs at once
Questions Buyers Ask
How much budget does a multi-channel programmatic campaign need?
Direct enterprise contracts on platforms of this tier have typically required monthly minimums in the tens of thousands and beyond, which is what pushes most independent advertisers toward managed access. Practical channel counts matter more than the headline figure: a budget spread thin across every format usually underperforms the same budget concentrated in two channels with a proper hold-out. Our small business agency comparison and enterprise brand comparison both address the threshold question.
How quickly does platform access happen?
AdGeeks states a turnaround of 48 to 72 hours after a signed contract and an agreed strategy. Campaign build time sits separately from access time, and the sequence above reflects a realistic first month.
Should budget split evenly across the three channels?
Rarely. Split follows the objective and the maturity of the conversion path below the campaign. A brand with no retargeting pool has nothing to feed with upper-funnel reach, which argues for signal-rich channels first. Established brands defending share invert that logic.
Which reporting should arrive weekly rather than monthly?
Pacing, frequency distribution, domain-level delivery, and creative variant performance. Attribution and incrementality readings need longer windows and lose meaning when reviewed every seven days.
Does switching agencies mean pausing live campaigns?
No, provided the handover covers platform ownership, historical data export, and audience list portability before anything moves. The switching guide sets out the sequence.
Where to Take This Next
Programmatic rewards the operator rather than the buyer of software. The 21.9-point quality gap ANA recorded is an execution gap, which means it responds to governance, curation, and honest reporting rather than to a larger budget. Any agency conversation worth having starts from that premise.
AdGeeks provides managed access to DV360, Amazon DSP, and Adform without enterprise minimums, across display, video, connected TV, audio, and out-of-home. Start with the case studies if you want proof before conversation, request access if the platform question is settled, or talk to sales for a channel plan against a live brief. More background sits in the news and insights library and on the about page.
SOURCES
ANA Programmatic Transparency Benchmark, Q1 2026, published 27 May 2026. Figures on qualified impression conversion and the 21.9-point gap. ana.net
ANA Programmatic Transparency Benchmark, Q4 2025, published 25 February 2026. CTV share of programmatic spend, private marketplace share, server-side ad insertion measurement effects. ana.net
ANA Programmatic Transparency Benchmark, Q2 2025, published 14 August 2025. Domain counts, MFA median spend, private marketplace and open marketplace CPMs, carbon intensity. ana.net
ANA Programmatic Media Supply Chain Transparency Study, June 2023. The 44,000-site campaign average. ana.net
IAB 2026 Ad Spend Forecast, January 2026, survey of 205 buy-side executives. Channel share figures for digital display and linear television. streamtvinsider.com
IAB Digital Video Ad Spend report, July 2026, survey of 360 media executives conducted by Advertiser Perceptions with Guideline data. Online video, social video, CTV spend and buyer worries. mediapost.com
eMarketer forecasts for US CTV ad spend and 2026 upfront commitments, as reported August 2026. Note that eMarketer publishes slightly different CTV figures across releases, so treat the topline as directional. stackadapt.com
Every figure above comes from the cited publication. Where two organizations report different CTV totals, the difference reflects definitional scope rather than a contradiction, and both are given.